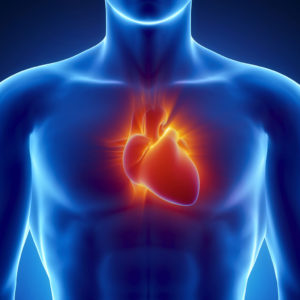
Heart analysis in 3D visualisation
The CardioDM-06® (Heart Vue™) is significantly different from conventional ECG analysers, as it is based on a new approach to analysing the ECG signals – the ECG Dispersion Mapping (ECG DM) method.
The ECG DM is the analysis of dispersions of the low-amplitude oscillations of the ECG signal in certain intervals of the PQRST complex, which is not available in standard ECG analysis methods.
It therefore facilitates:
- detection and localisation of pathological changes in the heart in early stages
- detection of even small metabolic deviations (shifts of electrolytes, ATP (adenosine triphosphate) concentrations) and other metabolism parameters which precede the ischemic heart damage.
- higher sensitivity and specificity for cardiac diagnoses (at myocardial ischemia the sensitivity is 80% and specificity is 75%). Depending on particular pathology, such sensitivity of the device surpasses standard ECG analysers 7-50 times.
- more efficient distinguishing between arrhythmia and a client’s tension or anxiety
- the use of new information from ECG fluctuations, usually ignored as the “noise”, as compared to conventional ECG devices.
- fast recognition and estimate of cardiac status
- representation of cardiac abnormalities or stress in 3D visualisation instead of demanding measurement and logical analysis, as it is in the standard ECG.
- evaluation of stability of the current heart condition. This is very important, as a heart with large deviations can be stable (these patients often have long survival times), and, by contract, a heart with small deviations can be extremely instable and decrease of dangerously unexpected relapse.
- better monitoring during the therapy thanks to 3D visualisation
- provision of much better diagnostic data, as compared to automatic ECG devices.
Examination result:
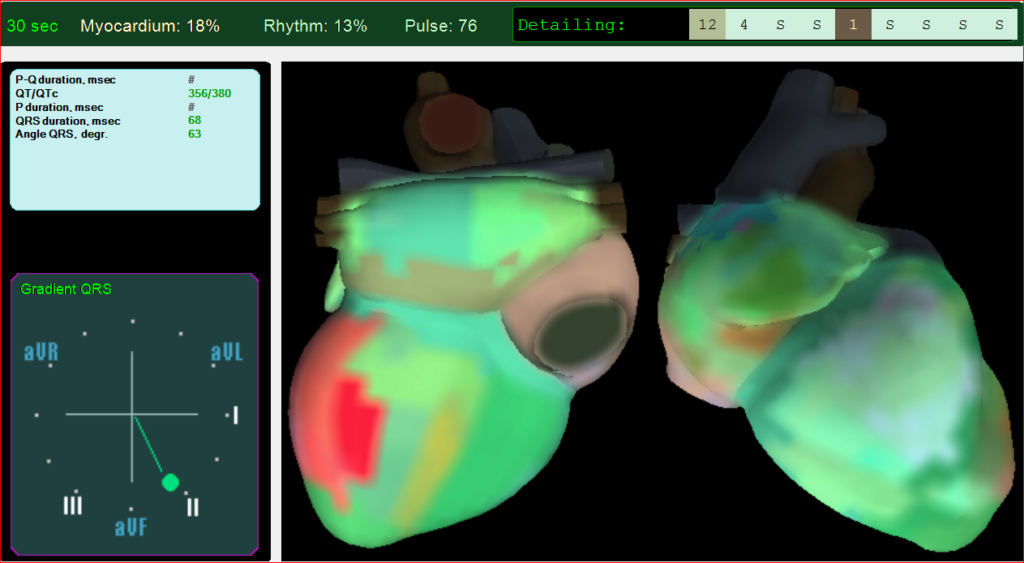
The Heart Vue produces not only a conventional ECG record but also a map and analysis of QT dispersions – values of cardiac changes, the so-called heart portrait (3D visualisation). The analysis lasts for 30-60 seconds as the constant monitoring of the ECG signal.
Heart portrait:
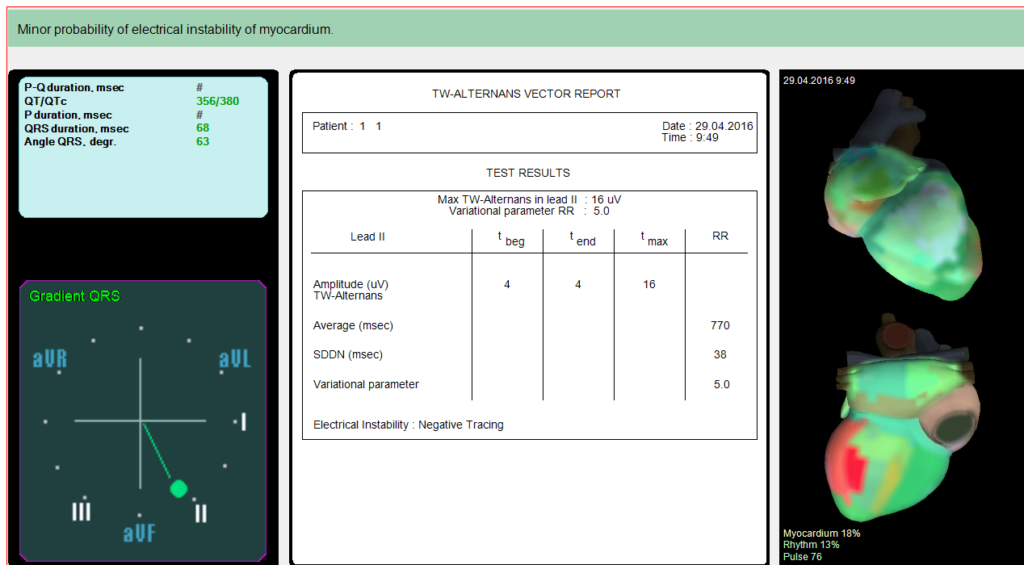
Result of electric stability of the heart– differential diagnostics of cardiac arrhythmia, dysrhythmia
Examples of findings:
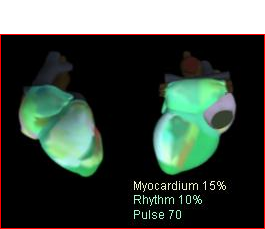
Normal heart image
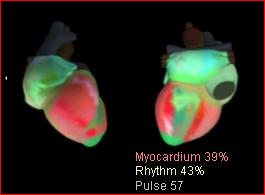
Myocardial ischemia
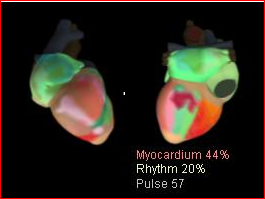
Myocardial ischemia, previous myocardial infarction, left ventricular hypertrophy
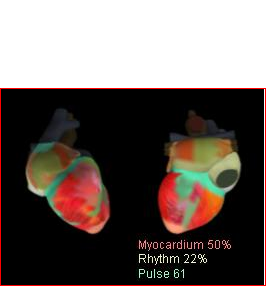
Myocardial ischemia, atrial fibrillation, arterial hypertension, recurrent myocardial infarction (MI)
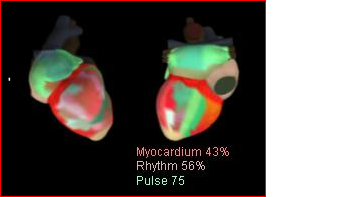
Myocardial ischemia, previous MI, diabetes mellitus in a client’s history
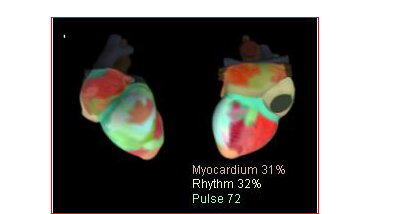
Atrial fibrillation, changes in cardiac metabolism
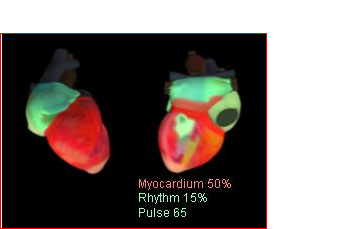
Asymmetric hypertrophy, cardiomyopathy, Left Bundle Branch Block
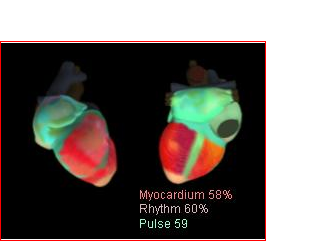
Acute MI, posterior wall hypokinesis
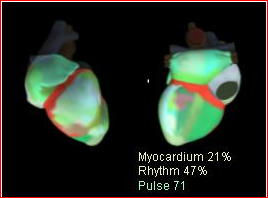
Disorder of cardiac valves

Combined cardiac disease, atrial fibrillation, metabolic deviations
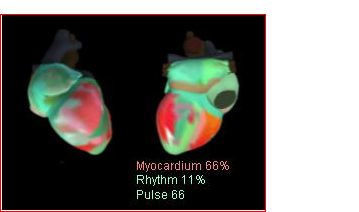
Myocardial ischemia, previous MI, stenocardia, aortocoronary bypass


